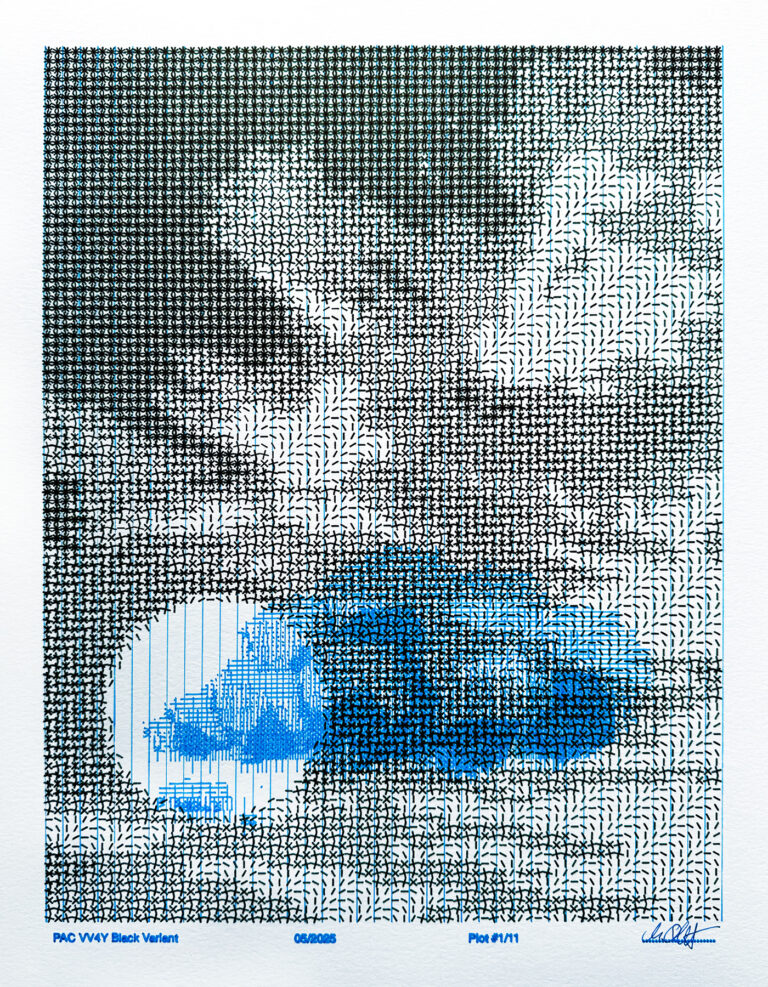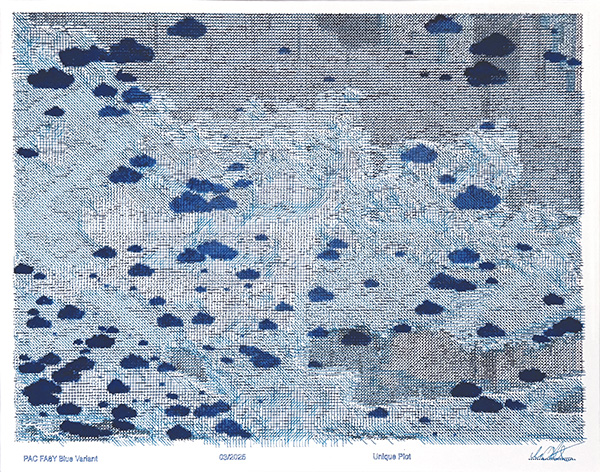
PAC: Nodes of Resilience is a generative, pen-plotted data visualization of the growth and strength of the Bitcoin node network over the past six years.
For me, the number of active nodes is one of the clearest indicators of blockchain adoption and network strength. Each node independently verifies transactions and holds a full copy of the ledger; the more nodes, the more distributed the verification, and the harder the network becomes to disrupt, censor, or capture. Aggregating Bitcoin’s active node data across this period reveals that despite the so-called crypto winter, the network has continued to grow stronger. Measured annually from Bitnodes, the number of reachable Bitcoin nodes grew from 8,971 in 2020 to 20,839 in 2025, more than doubling across a period that included two significant market downturns.
The data is organized into six annual cloud clusters, one for each year; the density of clouds within each cluster is directly proportional to the number of active Bitcoin nodes recorded in that year. The plot is drawn onto nine folded notebook pages, which together form a mosaic. Installed, the nine pages are arranged to read as a waterfall, with the Bitcoin node network shown growing upward against the political, social, and financial currents that continue to work against Bitcoin’s success.
Plotting Against Centralization is the overarching series, which traces the rise of Bitcoin across the globe. Set against hostile financial, regulatory, and political forces, these algorithmic visualizations turn precise data into quiet acts of defiance, data art hidden in plain sight.